Flexible data pipelines using Microsoft Azure for predicting drinking water quality
30/03/2021 - Dr Andrew Gordon
Recently, we’ve been working with Northern Ireland Water to develop a novel system which seeks to use Machine Learning to unearth the key dependencies between a wide range of telemetry features and predict multiple aspects associated with final water quality. A novel water quality score was created which provides an aggregation of various final water quality metrics as a single, easy-to-understand metric for both process control managers and engineers to assess, at a glance, the status of the water treatment plant.

In this post, we consider an analogous system which ingests data from three sources – telemetry data, chemical data and weather data. This data is ingested and converted to a format which is suitable for the application of an analytics framework of four Machine Learning models, providing predictions of a proxy variable for final water quality on a Power BI dashboard. Each of these models makes a prediction for final water quality for each of one, two, three and four hours in advance, using data from the above sources over the past six hours.
Whilst it is no small task to choose a model (or series of models) which can isolate these dependencies and adequately predict final water quality metrics with an appropriate degree of confidence, this blog post looks at the analytics infrastructure around the deployment of models and the presentation of results to the user, all in real time or as close to this as possible.
In order to consider the architecture of an end-to-end solution in this manner, we need to look beyond the flat files, which Data Scientists are used to being served as their ‘bread and butter’ at the start of any such project, and identify the different data sources involved in the project. For water treatment, this will usually entail telemetry systems, chemical/laboratory data, weather data and land use data, in addition to many others. Each of these sources will likely have different data formats (eg. database, flat file, handwritten, etc.), frequencies of collection (eg. daily, hourly, etc.) and confidences in accuracy due to method of capture (eg. sensors, human, etc.), as well as many other variations. Depending on the nature of the data sources involved, the approach for integrating each into the data pipeline so that future predictions can be automated may vary.
Knowing that we wanted to build a system which could handle a large number of features, updated often and at irregular intervals of time, and subsequently apply Machine Learning approaches which should return results to a custom dashboard, all close to real time, it was necessary to avail of the power and scalability of cloud computing. The choice of service provider was Microsoft Azure – one of the leading providers for applications of this nature.
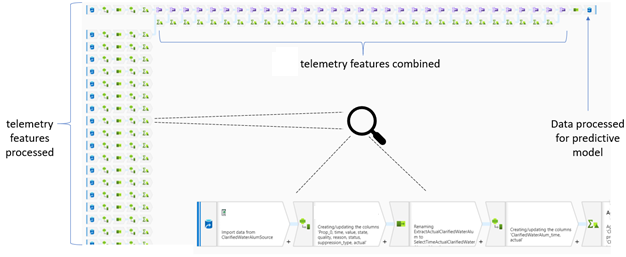
The first part of the consideration of the data pipeline architecture required the provisioning of a location in the cloud where incoming telemetry data could be processed and aggregated, to a format that is then suitable for the models to take in and make their predictions. Initially, this was carried out using Azure Data Factory, which is a cloud-based data integration service that allows the creation of data-driven workflows in the cloud for orchestrating and automating both data movement and data transformation. Essentially, this service is attempting to provide functionality similar to SSIS (SQL Server Integration Services), on the cloud. Although a little cumbersome to click through a number of pre-defined operations (with some limited customisation through guided coding), it does provide a aesthetic diagram/flow-chart which illustrates the operations that are happening to the given features:
When implementing this step in the overall data pipeline using Azure Data Factory, the performance was much slower than we desired. It’s important to note that we want to make a series of predictions every hour. However, Azure Data Factory ‘spins-up’ (or initiates) a Spark cluster – virtual powerful computing machines – on each occasion that we would want to make a prediction. Unfortunately, there are overheads to consider on each occasion – we found that these overheads could take anywhere between 3 and 12 minutes, before the pre-processing of data is complete and the result is passed to the Machine Learning models. This really burns into the time which could be better spent making interventions based on the first 1-hour water quality prediction (which is now potentially 10-15 minutes shorter, because of this overhead time).
Spark is a very powerful analytics platform for big data processing in parallel, but only if complex calculations and big data processing are happening frequently. In other words, it is well suited for situations in which a cluster is initiated and many of jobs are sent to it either successively or in parallel. Where such a cluster is started for just a single job and then shut down until the next hour whereupon the process repeats, we found this to be inefficient and not suitable for the application. We found that for the data sources and features involved, the degree of pre-processing required is neither worth the sizeable and significant initialisation time, nor justifies an ‘always-on’ cluster due to the costs.
Azure DataBricks offers Spark on Microsoft Azure Cloud services – this also had the potential of suiting our use case. Having an advantage over Azure Data Factory because it allows direct coding of the data transformations and pre-processing steps, we could much more easily specify what needed to take place for the data arriving from each data source. However, whilst there are different tiered offerings and associated pricings, it still tended to be very expensive for size of the data sets and the required degree of processing. Once again, this is because Spark clusters are provisioned using Azure DataBricks.
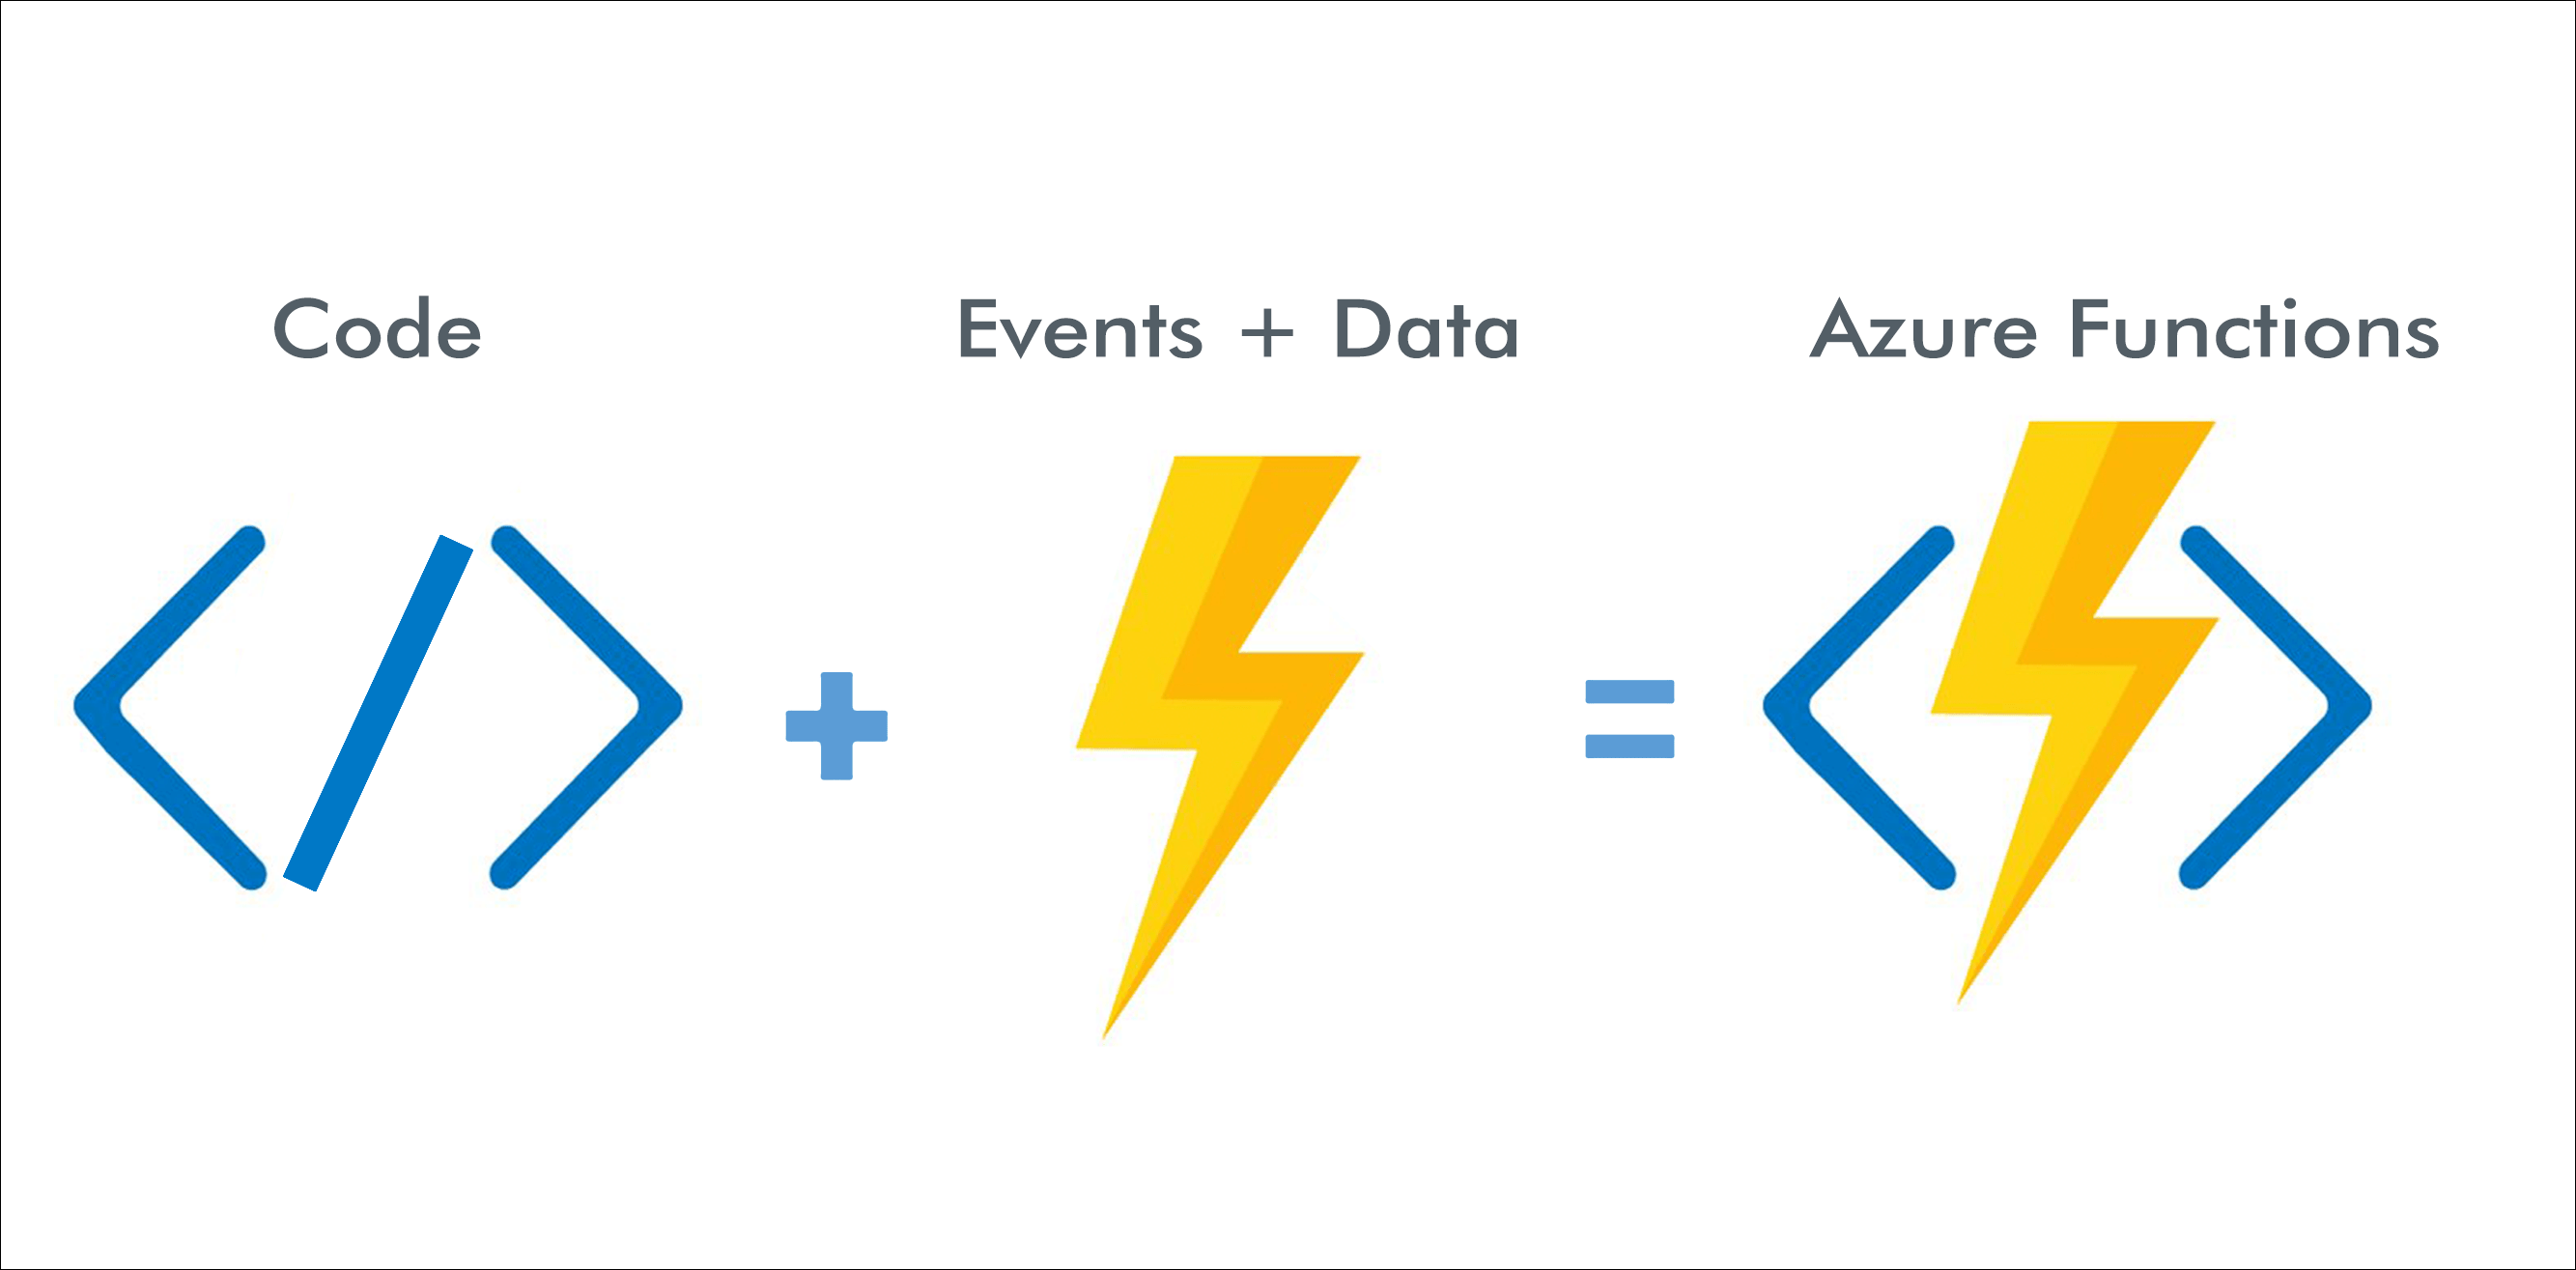
Finally, we considered the use of Azure Functions. These provide the supported functionality and the ease with which carrying out the data pre-processing and computations required could be specified, was very attractive, all in a manner which was serverless. Due to its very low cost, together with its fast implementation speeds, we found this to be the best mechanism to provide the service for this part of the data pipeline. The only limitation we found, is that any calculations within the function are capped at taking a maximum of 15 minutes, but this was not a concern for the application under consideration. For applications which are highly computationally intensive with regard to the implementation of their data pipeline, one of the above alternatives may yield better results.
In fact, through using a single Azure Function (together with some clever thinking!), we were able to read the required data files (from each of the different sources) from an online transaction database. This database contained a variety of tables which updated at a range of different intervals to record the latest data. The Azure Function was programmed to query the latest data at the turn of each hour and append this data to that of the previous five hours (giving a six hour sliding window). This resulting data was then passed to the Machine Learning models (built using the Azure Machine Learning service), returning the predictions and aggregate water quality score to the database. From there, Power BI scans for these updates (using the 'Direct Query' service) and displays them on the custom dashboard, providing seamless and automated updates for the user. Other trigger functions may be used to invoke certain functionality or steps within an Azure Function, such as HTTP requests, file triggers and queue triggers.
In general, there is a fairly large degree of variety around the combination of different functionalities which were possible to achieve using Microsoft Azure, and we found Power BI a pleasure to use. It provides charting ‘out-of-the-box’, but also allows more complex/bespoke charting using Python and R libraries and coding. This was a feature we used a lot! In particular, linking in with the predictions from Azure Machine Learning which are written and read from the database on a schedule was really useful. However, we uncovered two limitations with using Power BI for an applications such as this. Firstly, the refresh schedule can not be updated any more frequently than every 15 minutes. Given that each set of predictions is being updated every hour, this wouldn’t cause too much of a problem in production for us.
The second limitation is a little less relevant for the application case study described here. Unfortunately it doesn’t seem that Power BI supports user input (above and beyond simple sliders and check-boxing). The system we’ve outlined in this article is part of a wider solution which seeks to create a digital twin of the process, where users can make changes to the system and observe the predicted effects on overall water quality, without needing to actually interact with the physical system. A greater (or more granular) extent of user input would be essential for a user to make changes to the digital twin and underlying analytics model. For the integration of such features within the overall architecture Power BI may be replaced by a Dash UI (from the Dash Python package), or alternatively, a custom web app.
Although this has been somewhat of a whistle-stop tour through the end-to-end architecture of an advanced analytics solution (without even dwelling on the Machine Learning models involved!), it is worth noting the flexibility of architecture. Once identified and constructed, the data pre-processing and visualisation steps will only change if the data sources change and is not dependent on the models constructed within the Azure Machine Learning service. This means that it is possible to swap different modelling approaches in and out of the pipeline without affecting its ability to operate. We found this especially useful in our application, as a new data source (providing insights into a completely different angle of the water treatment process) is nearing specification and completion. Integrating this additional source into the proposed system architecture would simply require treatment of the pre-processing for this new data source and model re-fitting/selection using the new data, with all other parts of the data pipeline remaining consistent.
As Data Scientists, it can sometimes feel counterintuitive to suggest tackling a problem/project such as this from the system and architecture side first, before looking at (the more conventionally exciting!) feature and model selection tasks. However, doing so allowed us to quickly represent 'live' data from a highly complex process on screen quickly, even if the analytics and model-building was still to come, providing a number of quick wins for the client and instilling an early sense of satisfaction and ease in the relationship with AAL. The flexibility of cloud computing technologies, such as Microsoft Azure, means that not everything needs to be pre-specified or figured out ahead of time. The different services which help construct the data pipeline can be modified in isolation if there are changes to their inputs or outputs, most notably meaning that feature selection, model building and model validation can be carried out in earnest without consequence to the flow of the data pipeline and architecture.