The necessity for Advanced Analytics in the Manufacturing industry
21/05/2020 - Dr Andrew Gordon
The process control systems employed to maintain control and order on the factory floor of manufacturing businesses have evolved over time. Some of the earliest examples of process control systems include the invention of float valves, by Ktesibios of Alexandria in the 3rd Century BC, to regulate the level of water clocks and the invention of water valves (similar to the fill valve we continue to use in our toilets), by Heron of Alexandria in the 1st Century AD . Over time, aided by the development of sensors, electronic processors and graphical displays, the development of distributed control systems (DCSs) have allowed easy interfacing with other production computer systems. Consequently, this enabled the provision of high level overviews for both the manufacturing floor and even the entire plant as a whole.

In parallel to this, advances have been made within the fields of Statistics and Operational Research, with the theorisation, development and implementation of algorithms and methodologies, using mathematical functions and relationships, which have been proven successful in providing many tangible benefits across every sector imaginable in society. Unsurprisingly, process control systems have embraced a number of such aspects and methodologies from the aforementioned fields in order to further develop efficient process management protocols. Such methodologies include the monitoring of basic descriptive statistics (for example, the mean, standard deviation and other distributional measures of the production data), as well as the use of Statistical Process Control (SPC) where a random sample of output from the process is inspected, with the process deemed to either be in or out of control depending on whether the monitored data characteristics fall within a predetermined range. Furthermore acceptance sampling, where a decision is made to either accept or reject an entire batch of items based on the inspection of a certain number of items from the batch, is similar to SPC except that the decision to accept or reject the batch does not happen during the process, but instead either before or after it has occurred.
However, whilst the incorporation of knowledge from the fields of Statistics and Operational Research, into that of process control has provided the basis for a more efficient and generally less wasteful production environment, the Manufacturing sector has not experienced the further expansion that the explosion of Data Analytics has enabled for many other sectors. This is in part due to the complexity inherent in many production processes, particularly within high-value manufacturing, where in the most intricate production cycles, the successful production of a single unit may undergo tens of thousands of process steps, as well as tens of miles backwards and forwards across the factory floor. In order to effectively monitor and carry out interventions within such a production process, data should preferably be collected (usually via sensors) at each step that the unit passes through during production. However, due to costs and other constraints specific to the production process, it is possible that businesses may not have this data network in place yet, which means that the potential for further incorporation of Data Analytics is limited. Furthermore, for businesses which do have such a data network, they often do not have the analytics expertise required ‘in-house’ to navigate concepts such as big data management & processing, data streaming and the development of analytics models which can be used to predict potential faults in advance of their occurrence.
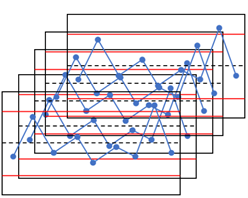
Further, exacerbating the issue, the simple methodologies described previously are acknowledged to be too simplistic and are perhaps now outdated when considering Industry 4.0 and how the new age of Manufacturing may interact with Data Analytics, both now and in the future. It is impractical to have multiple control charts representing tens of thousands of process steps. Furthermore, such charts can only provide meaningful information to process engineers at the univariate – single measurement – level, not accounting for the inter-relationships between multiple process steps and the potential quality of the final product. The same complexity also makes acceptance sampling unsuitable since, for economic reasons, it is not permissible to reject large quantities of units as the result of an undesirable round of random sampling.
Instead, an alternative approach is necessary in order to unlock the hidden trends which are occurring within the production process and, subsequently, to accurately predict, both where and at what process steps, particular units are likely to fail. However, to effectively manage complex production processes (like the one described above), it is necessary to first change our perception of how we quantify the success and failure of a unit in production. Consider the simple process containing four measurements below:
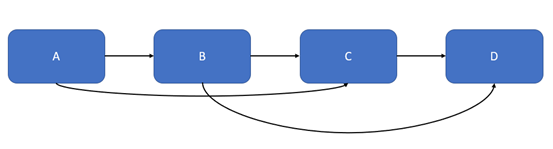
In this process, measurement B is impacted by measurement A, measurement C is impacted by measurements B & A, and finally, measurement D is impacted by measurements B & C. For this simple process, with the visualisation above showing the relationships between the four variables, a process engineer is able to understand the effect that changing the value of a particular measurement can have on the quality of subsequent measurements in the process. This is known as multivariate analysis and using this concept, predictions on the final quality of the unit can be traced very efficiently and the appropriate measurement step can be effectively corrected, without negatively affecting other measurement aspects of the build. Considering the above process without the knowledge of which measurements are affected by the rest and in a univariate sense alone, a process engineer may be inclined to change conditions for each measurement one at a time in order to bring that measurement back to specification. However, using this strategy there is no way of knowing the possible effects that this change for a given measurement may have for other measurements, potentially yet to occur downstream. Extending this idea to a manufacturing process with ten steps, this can start to become very complicated. Considering a process with tens of thousands of steps for the production of a unit, it is simply impossible for the human mind to comprehend and understand all of the possible relationships between each and every one of the measurements.
This is where Machine Learning techniques can shine some light. This has been one of the ‘buzz’ phrases within Data Analytics and Software Engineering over the past ten years and, as such, there are different understandings, interpretations and expectations as to what it means! My understanding of Machine Learning is the mechanism by which algorithms can be developed and implemented to learn relationships within data which would be difficult or impossible for humans to do alone, possibly because of the volume of the data or the obscurity with which relationships are hidden within the data. From the process control example with tens of thousands of steps within a manufacturing process outlined above, both of these challenges are immediately recognised and evident, making the task a suitable one for the application of Machine Learning techniques.
Innovation for the application of Data Analytics has developed slowly in the last couple of years, and is still very much at its infancy. As our flagship product, we have developed FourPointZero, a cloud-based intelligent analytics software which extracts insights from high-value manufacturing/process data and provides companies with the expertise to understand how to reduce the variability in production. It provides an interface whereby a user can view all of the units that are currently in production, and when the user selects a particular unit they can view a visual representation of the key measurements and their status for that unit in the overall manufacturing process. An advanced Machine Learning and Artificial Intelligence algorithm enables process engineers to identify units which are predicted to be inconsistent, no matter how far along the manufacturing process they are, and where corrective action may be taken to bring them back to specification. The predicted quality is given by a novel ‘sameness score’ which takes a value between 0 and 100, where a score of 100 is indicative of the ‘gold standard’ quality – a perfect unit.
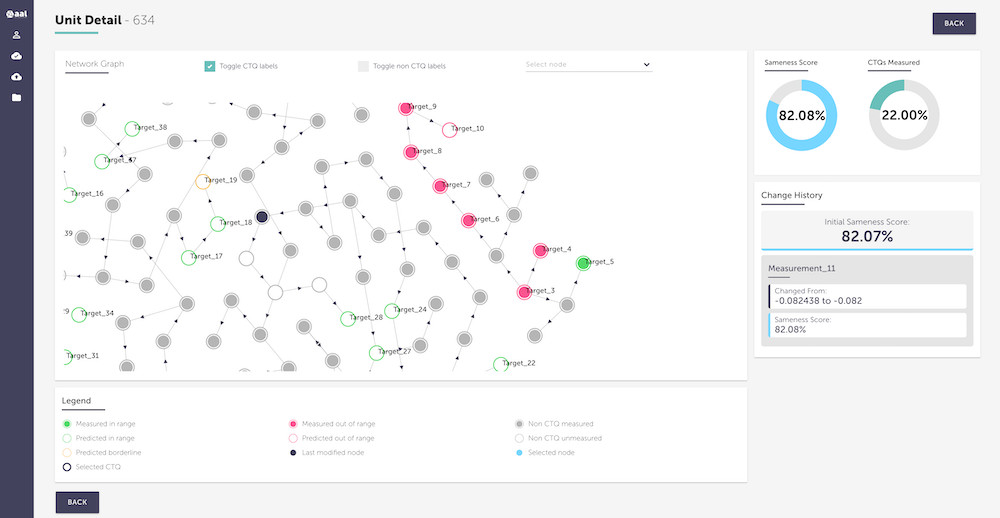
FourPointZero creates a Digital Twin of the production process, where the underlying relationships between metrology points identified by the algorithm, are mapped out in an easy-to-use and accessible network diagram, allowing process engineers to visualise key quality dependencies between measurements. Furthermore, the network diagram and underlying Machine Learning algorithm can be queried and tested under different scenarios, in order to determine the best course of action for units that are predicted to fail final specification. For units for which this is the case, the process engineer can visualise precisely which measurements are either out of range or predicted to be out of range. They can subsequently input potential measurement changes (perhaps representing additional drilling depth or reduced bevelling of a component) using the user interface. Subsequently, this calls the underlying algorithm and returns an indication as to whether the suggested changes are likely to result in an improvement to the final predicted quality.
This challenge of predictive maintenance and high-dimensional metrology data, together with the decision support provided by FourPointZero is just one example of how creative thinking and analytics expertise can be harnessed to provide a tangible benefit within the Manufacturing sector. Process control solutions incorporating Data Analytics should aim to facilitate consistently high-quality output, helping to maximise profits through fewer rejects, increased efficiency and less waste.
Nevertheless, it is not sufficient for creative thinking and analytics expertise to combine in isolation. It is also necessary for these concepts to engage with the existing production knowledge and subject-matter expertise, which has potentially been in development within the factory for a much longer time than the span of the recent Data Analytics ‘boom’. Process engineers may have decades worth of experience performing process control in a particular way which has been successful in the past; to use an example from above, in a univariate – single measurement – manner. There is an onus on the part of both the Data Analytics expert and the process engineer to educate (and possibly re-educate!) each other in order to find a truly creative methodology which can both provide a real benefit in terms of increasing efficiency or reducing waste, and perhaps more importantly, achieving buy-in from those in charge of the factory floor. Such considerations have always been, and continue to be, strong motivators for the application of any type of process control system within a manufacturing or process environment, whether it be in the time of Ktesibios of Alexandria in the 3rd Century BC or in modern day manufacturing as we currently know it.